U Prep Results

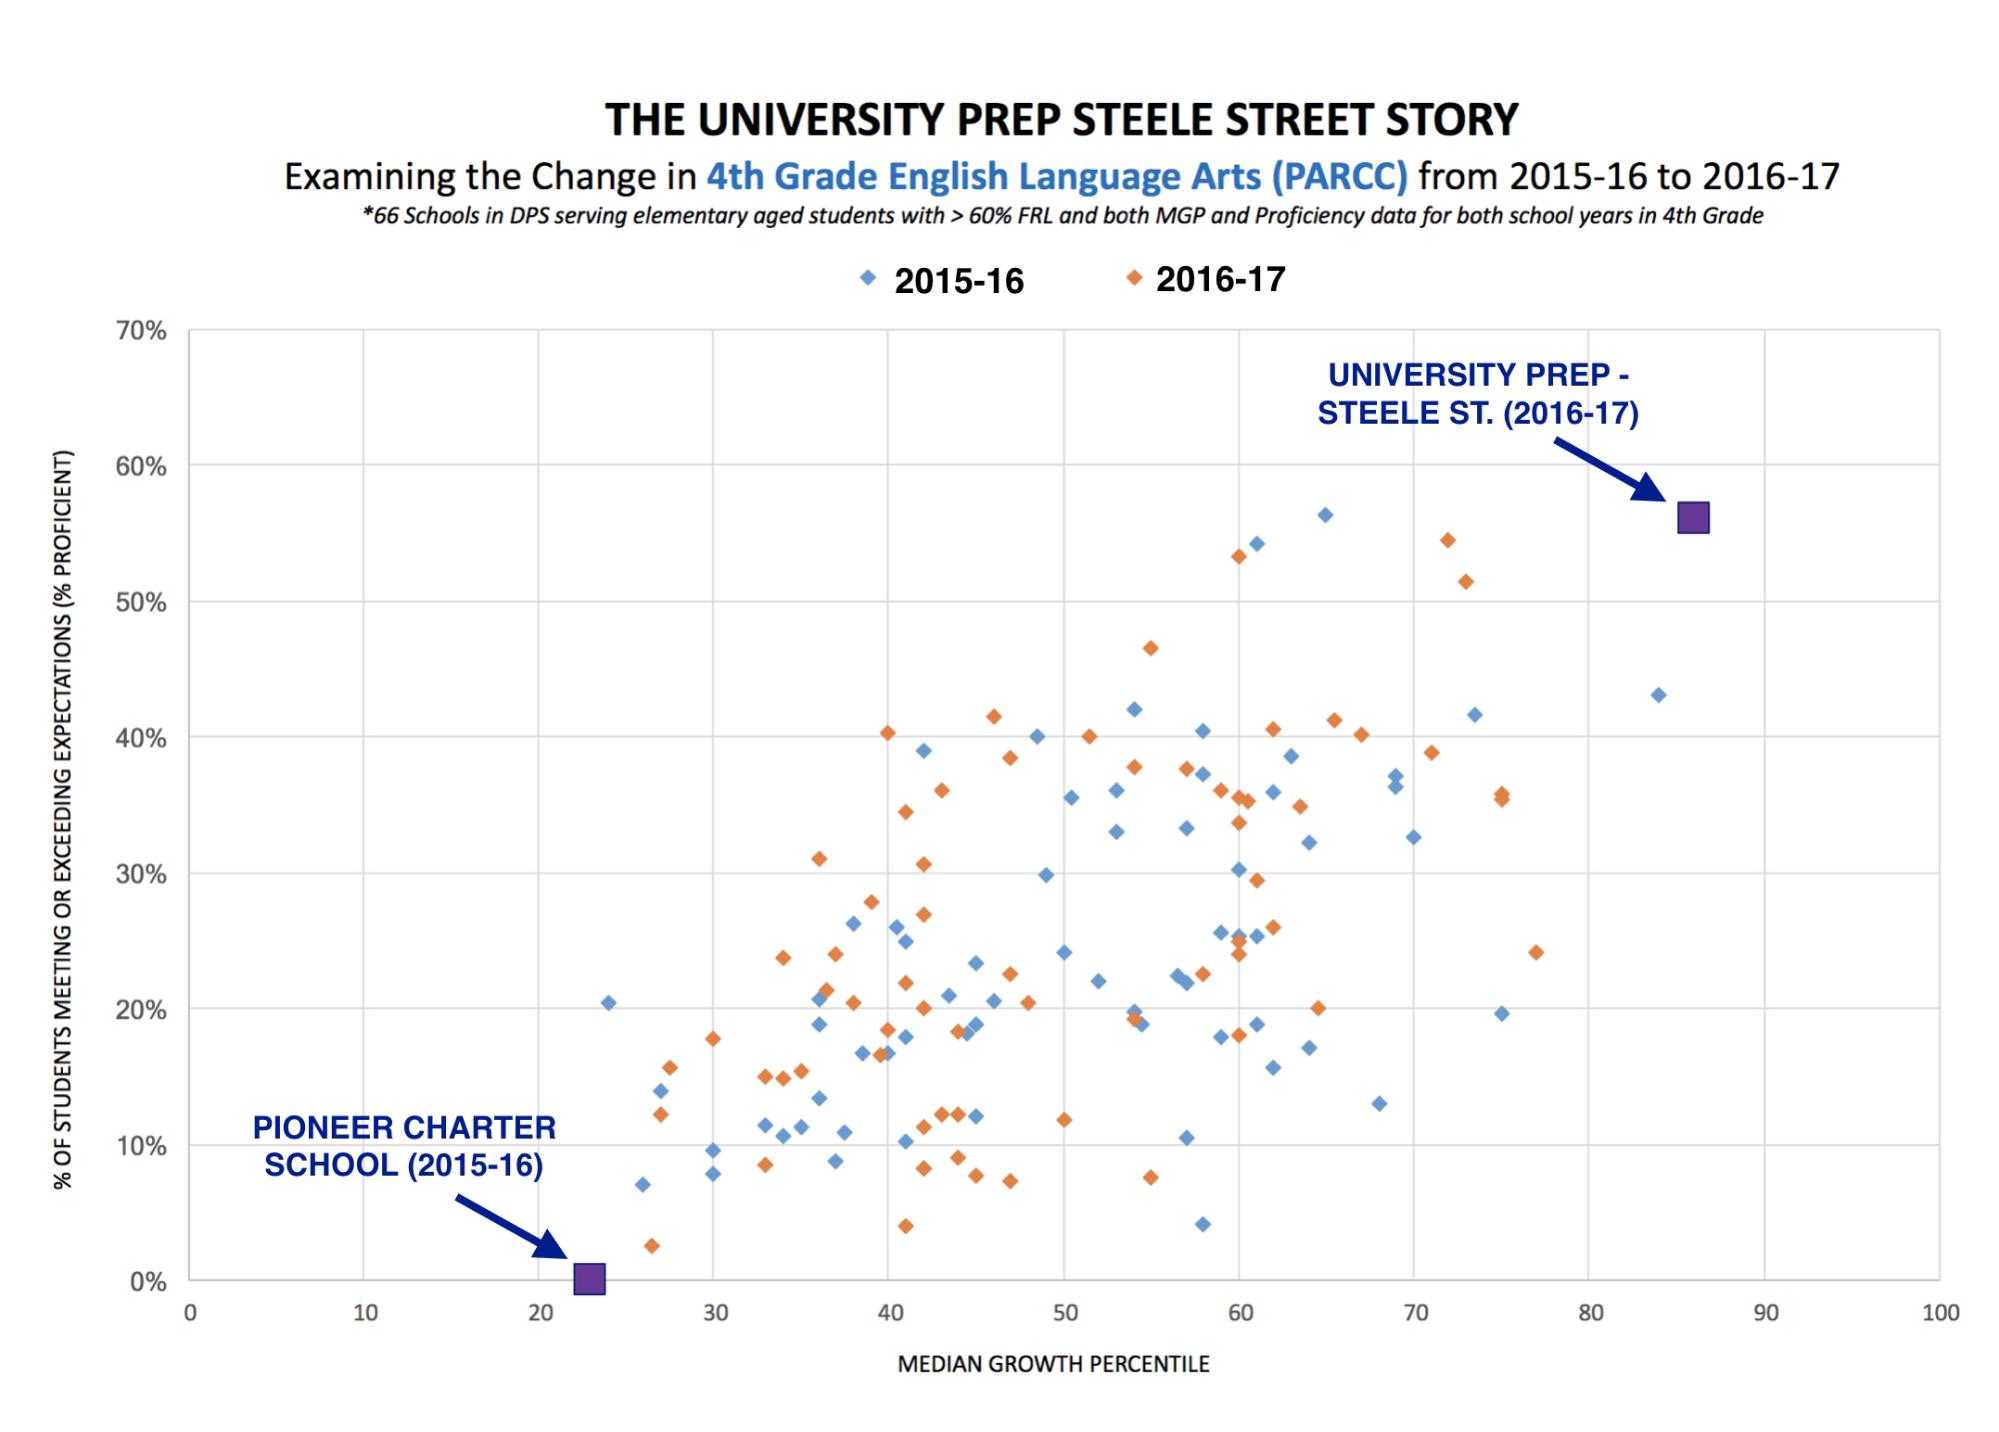
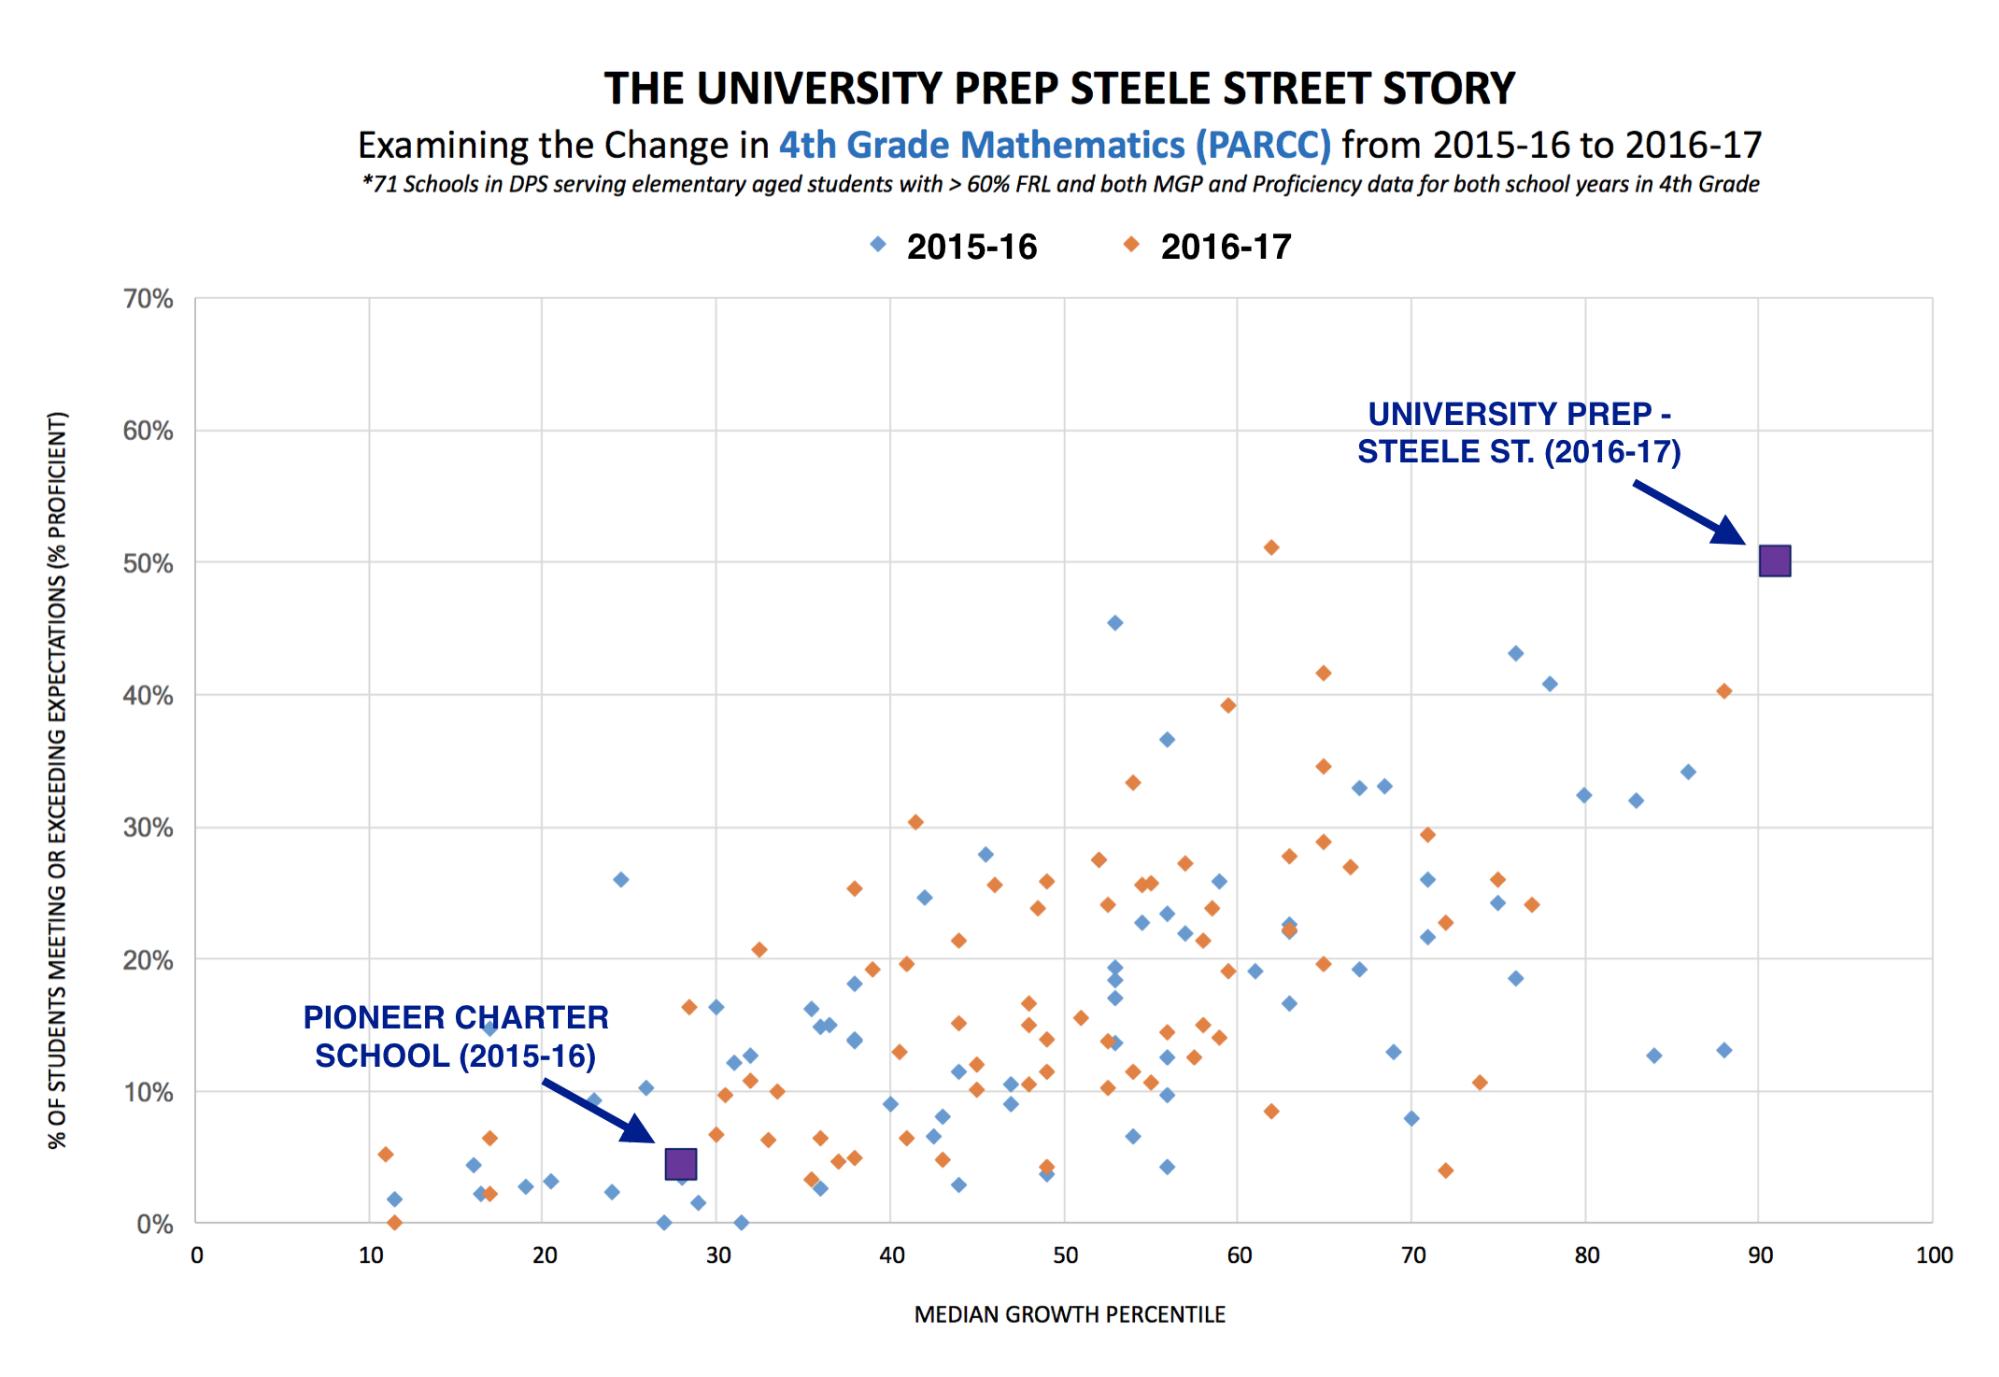
At U Prep results matter to us because they matter for our children. All of our children deserve a life of opportunity and the ability to choose their path.

According to the Colorado Workforce Development Council, in 2020 74% of jobs in our state will require a post-secondary credential. We work with our children and families to reach high academic outcomes that make those credentials and subsequent careers achievable.

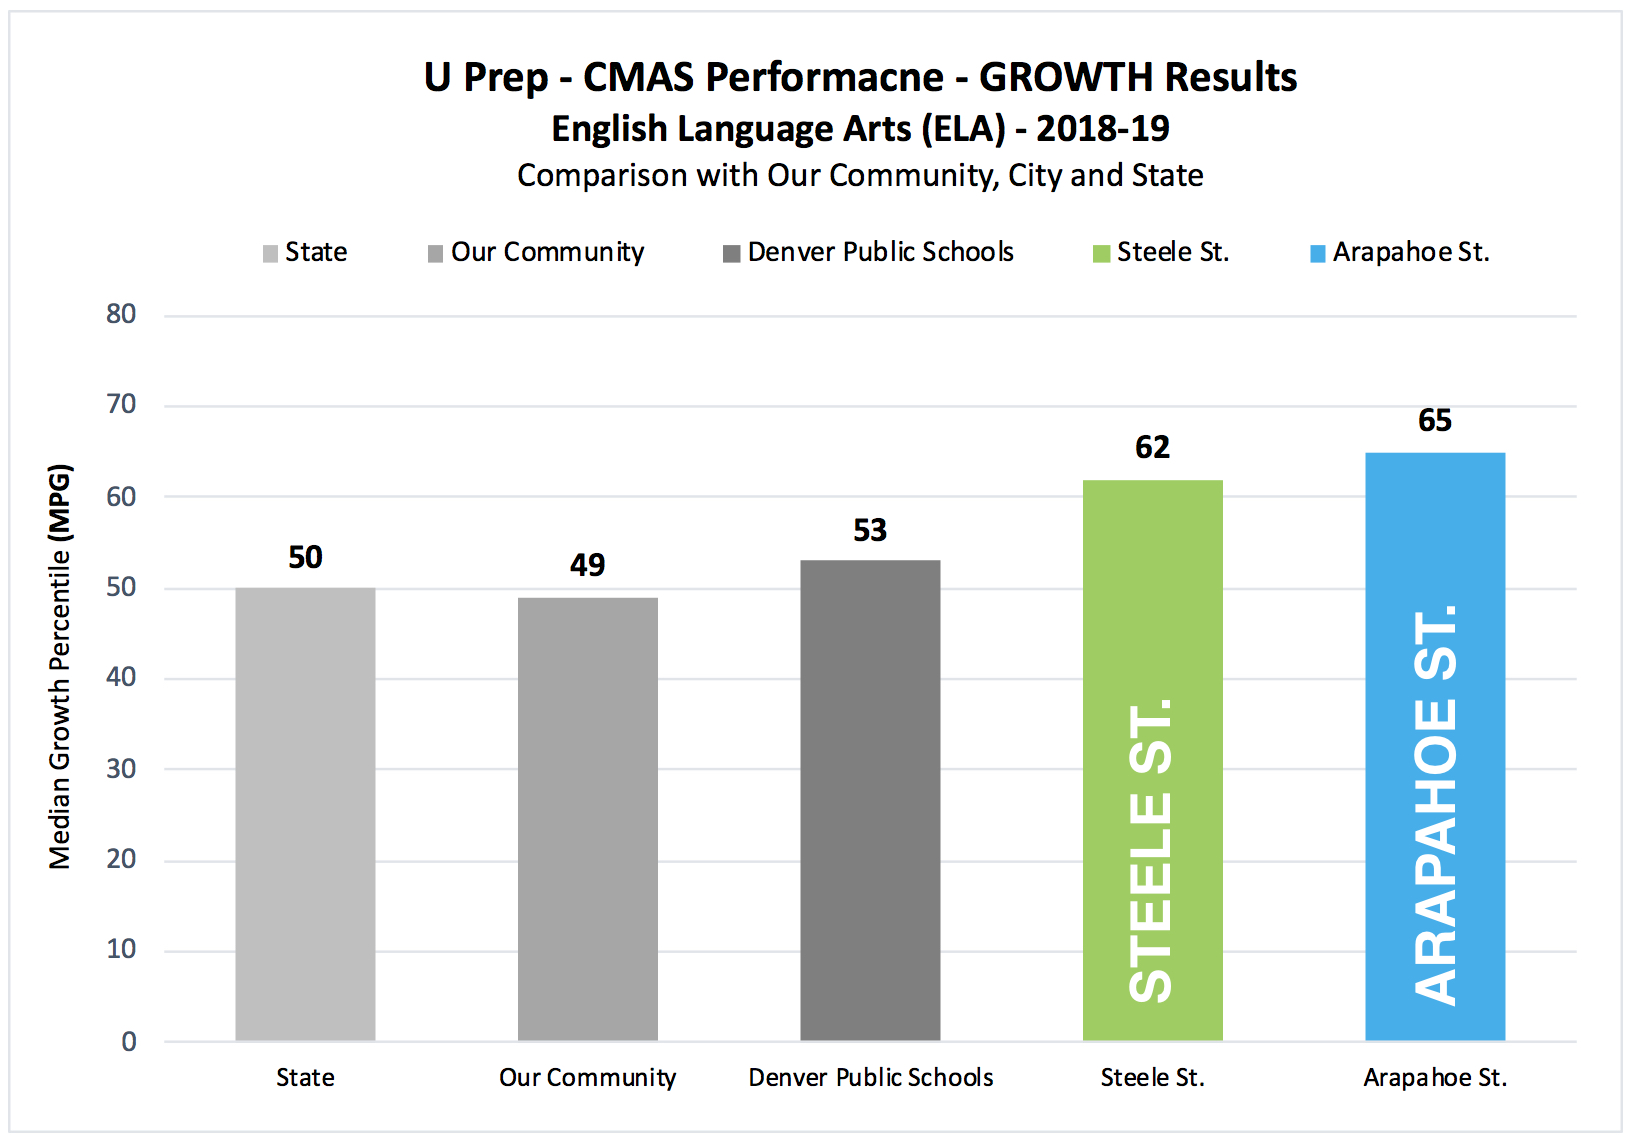
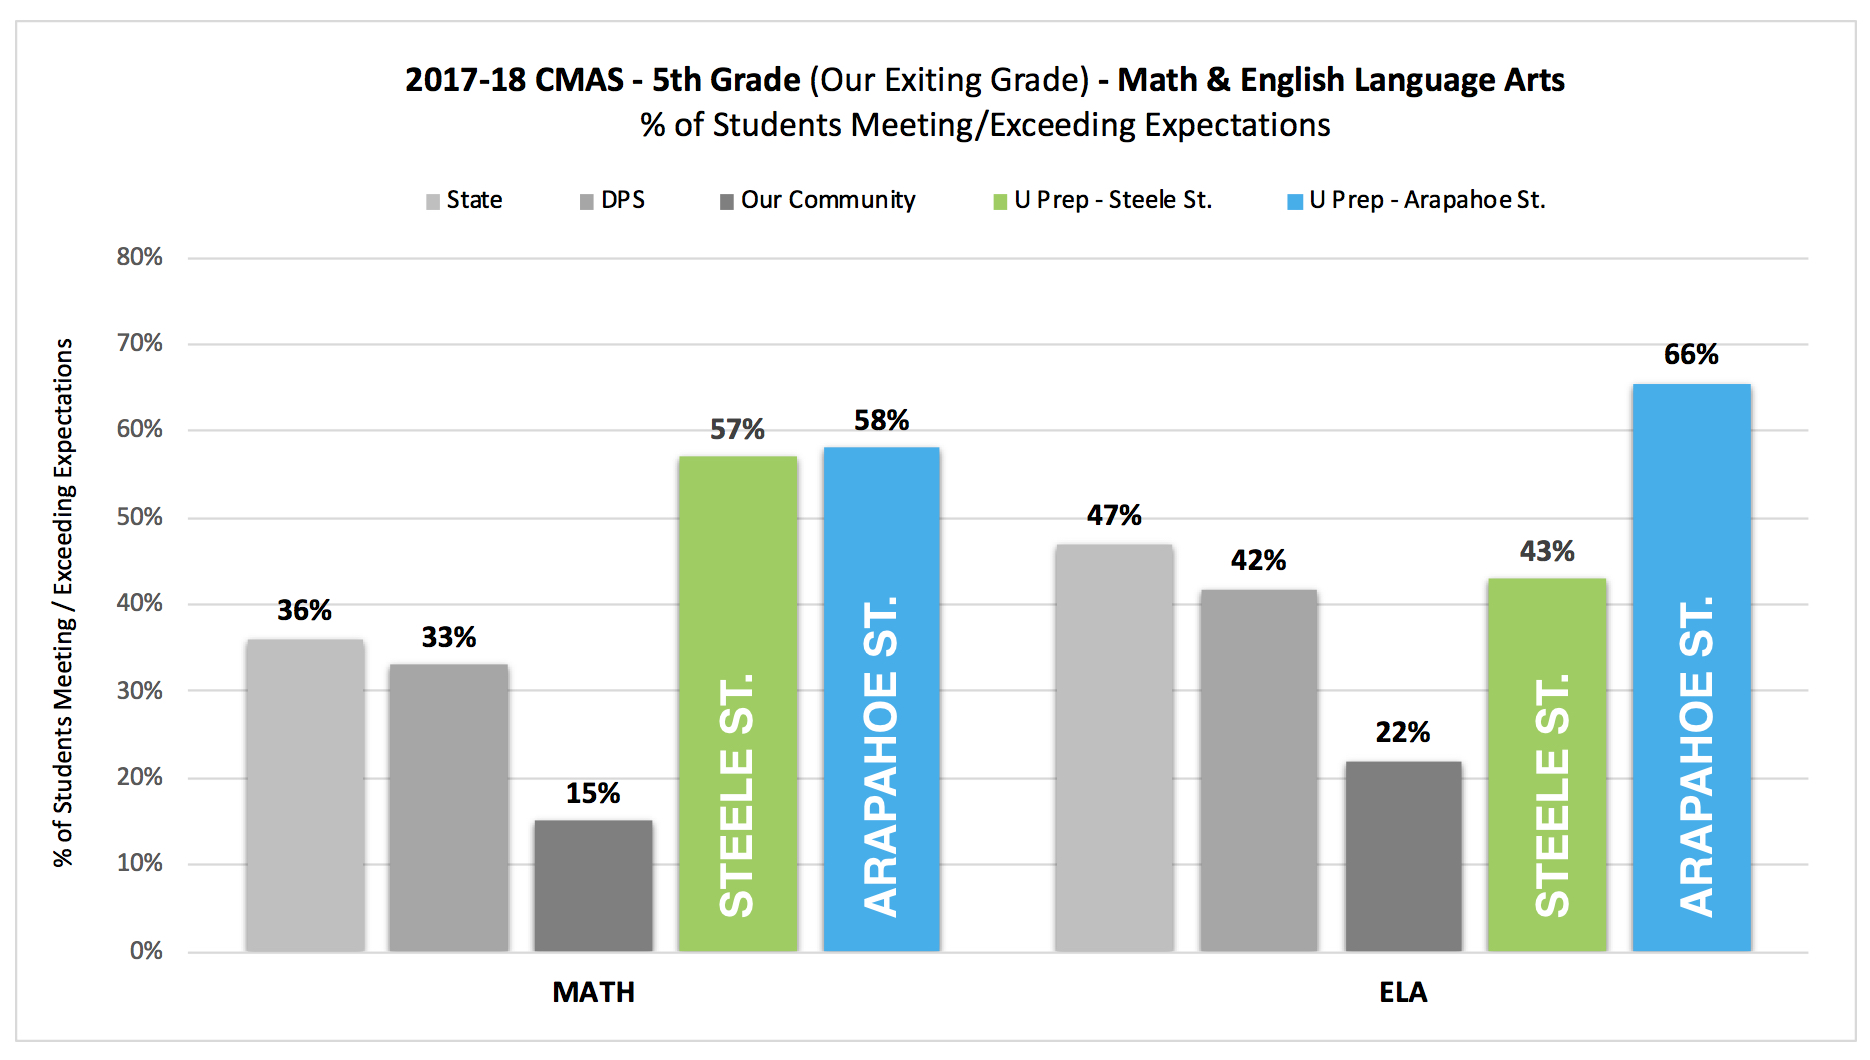
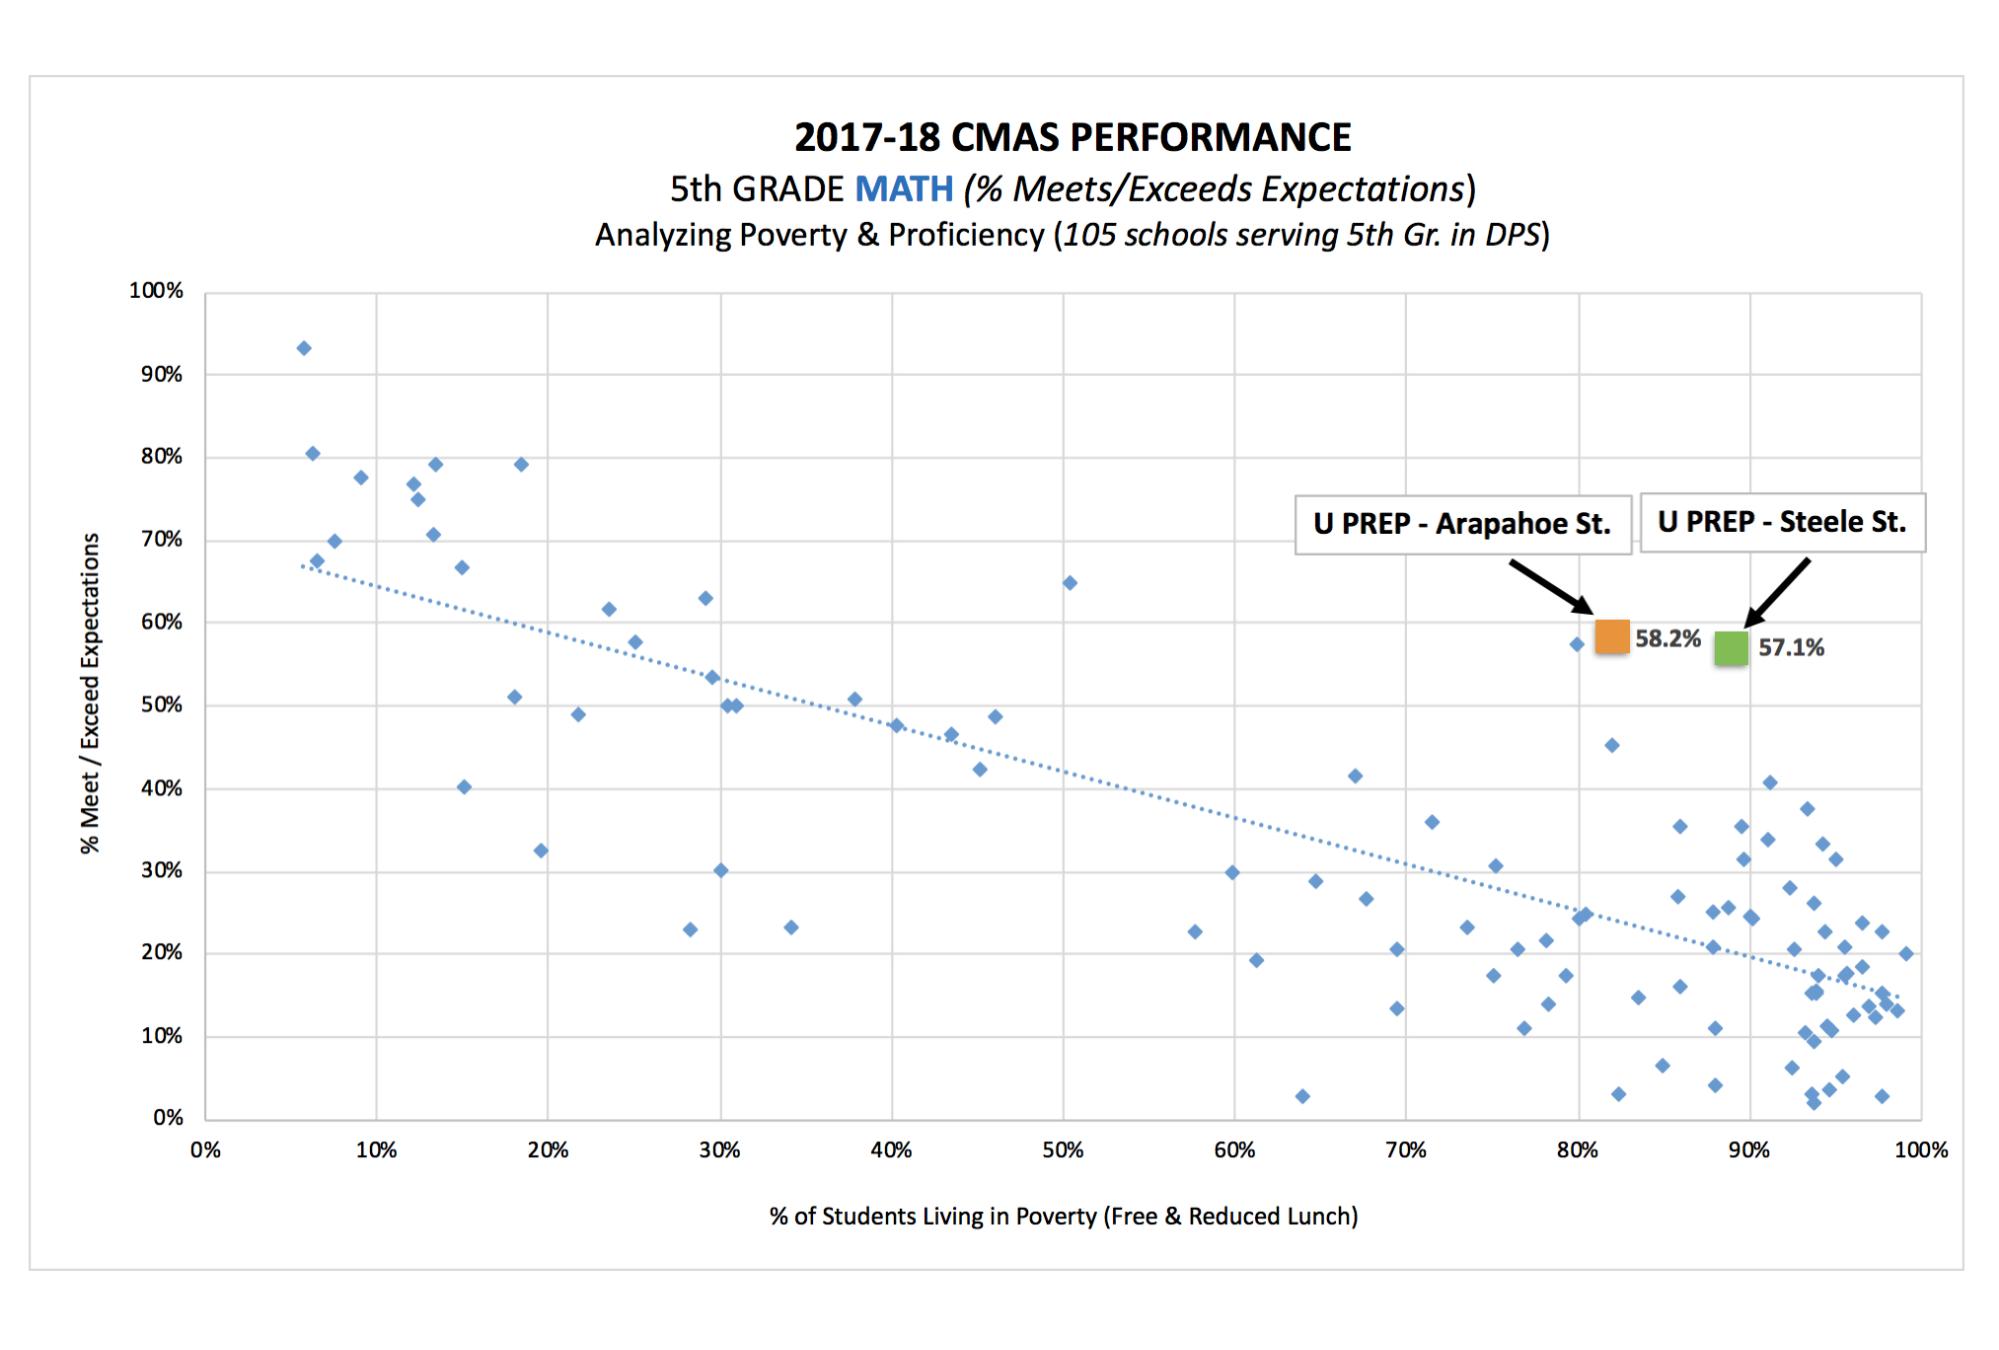
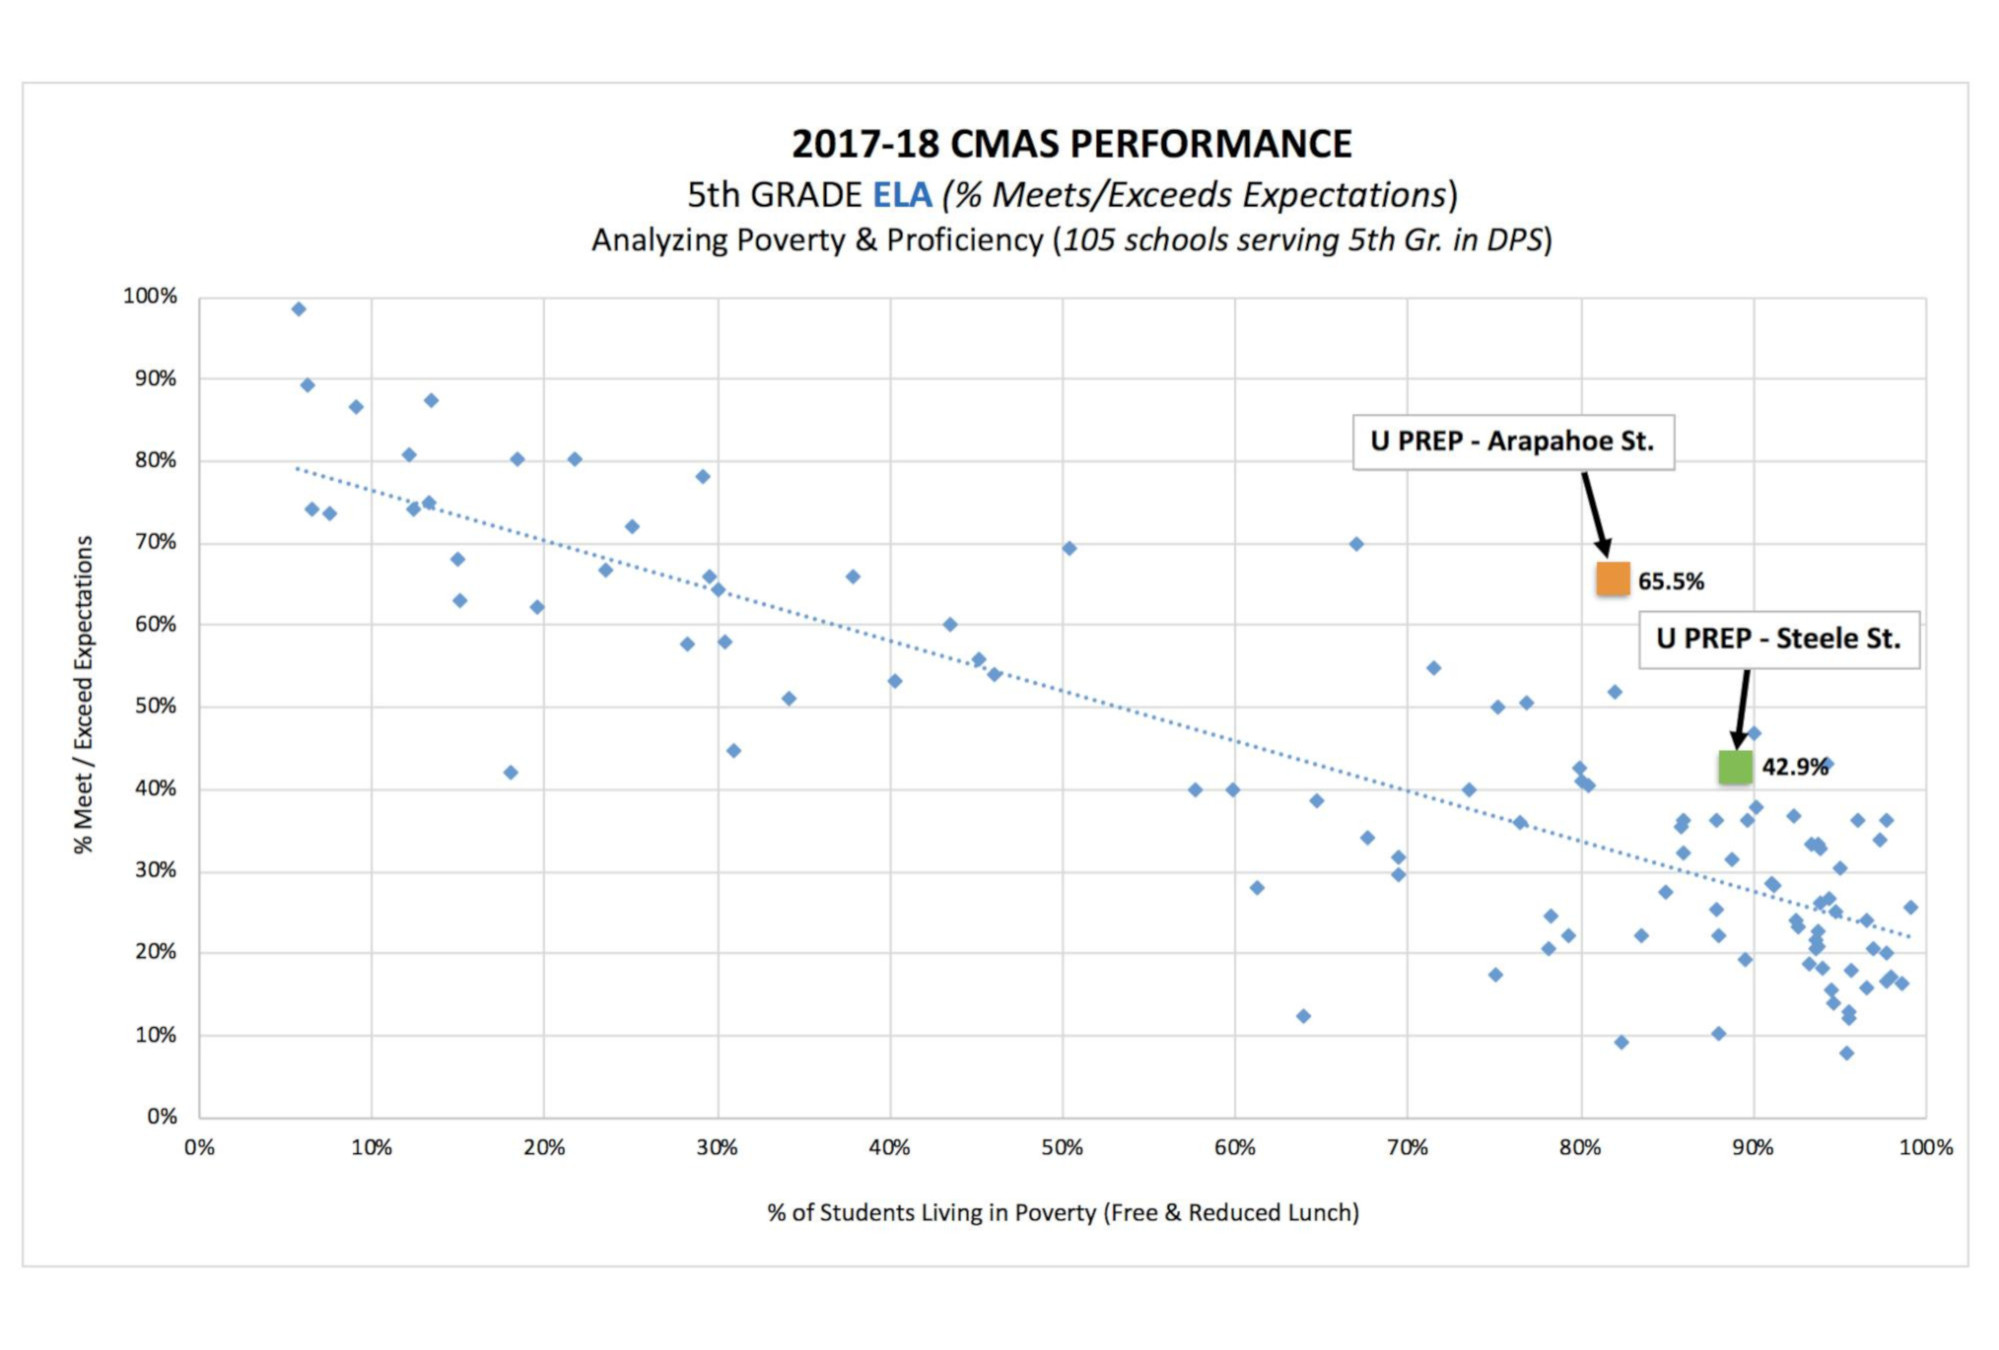
The results below demonstrate our shared belief in what’s possible for all children.

Reading & Writing

Growth

This graph illustrates that our scholars continue to grow at a faster rate in English Language Arts (Reading and Writing) than their peers across the state.

The growth of our 4th graders at Arapahoe St. was in the 90th percentile against all 100+ DPS schools while the growth of our 5th graders at Steele St. was in the 96th percentile against all 100+ DPS schools.

Chart: CMAS Performance - Growth Results English Language Arts 2018-19

Proficiency

Performance

Chart: 5th grade math and English language arts meeting/exceeding expectations

This data demonstrates that our 5th graders are in a strong position for their transition to middle school as they continue pursuing their dreams.

U Prep performance shows between a 2x and 4x factor in proficiency results when compared with schools across our community serving similar student populations.

All kids can achieve…

Demography is not destiny.

Chart: 2017-18 CMAS Performance 5th Grade Math

2017-18 CMAS Performance - 5th grade ELA

These scatter plots demonstrate that all kids can achieve – demography is not destiny. With 80 – 90% of our 5th grade scholars coming from low-income households, U Prep children are achieving at high levels. They are proving that your zip code and your socioeconomic status do not dictate your level of learning.

The U Prep

Difference

Examining the change in 4th grade English Language Arts from 2015-16 to 2016-17 chart

Chart: Examining the change in 4th grade mathematics from 2015-16 to -2016-17

These graphs spotlight the U Prep difference. Our turnaround efforts at Pioneer Charter School in 2016-17 transformed the school from being the lowest ranked in all of Denver to performing in the 91st percentile. The scatter plots show the dramatic increase in both proficiency and growth in a single school year. The school shifted from being the farthest behind and one of the slowest growing to the farthest ahead and fastest growing amongst its peer schools.

U Prep

Parent Pride

Not only do academic outcomes matter, experience matters too. This table illustrates the perception of our families and our children from the 2018-19 school year as we work together to achieve our shared goals.

Families % Agreement
Question/Statement
How satisfied are you with parent-teacher conferences that provide information that is clear, usable, and linked to my child’s learning96%
How well does your child’s school make parents feel welcome91%
How satisfied are you with your child’s school’s ability to provide academic support needed to meet your child’s needs91%
My child’s school is a safe place to learn91%
The teachers care about his/her success91%
My child’s school prepares him/her for the next academic year89%
Children
My teacher cares about me94%